Reading the NIST Report on 1:1 Face Recognition
NIST conducts the Face Recognition Vendor Test (FRVT), whose aim it is to measure the performance of face recognition technologies (FRT) applied to civil, law enforcement and homeland security application.
NIST’s evaluation gives us an insight into the state of the art of FRTs and the view provided by NIST is complementary to that offered by academic research papers, because:
- Companies are incentivised to participate in the FRVT, because US government agencies consult with NIST when making purchase decisions.1
- Companies can participate in the FRVT without having to expose their IP. The evaluation treats algorithms as black boxes: companies provide compiled binaries and NIST reports the performance without considering what happens inside the algorithm.
- Participants don’t have access to the data used in the evaluation and hence cannot tailor their solutions to the dataset.
What can we learn by reading the latest report on 1:1 matching?
Runtime and memory
NIST reports not only the accuracy of each algorithm, but also details about runtime, memory consumption and template size.
- A large number of algorithms uses a template size of 2048 bytes. This could indicate 512-dimensional embeddings with 4-byte precision. Some algorithms use smaller embeddings, 256 bytes or even less, but this comes with a penalty to accuracy.
- Most algorithms need 500-1000ms to generate a template, measured on a 2016 Intel Xeon CPU E5-2630 v4 running at 2.20Ghz. Interestingly, the runtime varies very little across images. For example, 667±2ms for deepglint-002. This suggests that the algorithm is a deep neural network that performs the same computations for all inputs without much branching.
- The fastest algorithms need less than 100ms, but they have reduced accuracy with an FNMR of 2% or higher, compared to <0.2% for the most accurate algorithms.
- Once the templates have been generated, the comparison itself is blisteringly fast, taking less than 10,000ns for most algorithms, again with very little variance.
Datasets
What accuracy can we expect from state of the art FRT? This depends on the dataset. NIST uses the following datasets for evaluation.
- Visa images, which are obtained from applications for US visas.
- Mugshot images, taken by the police after an arrest.
- Wild images, which include photojournalism-style images.
- Border crossing images taken of travellers crossing the US border
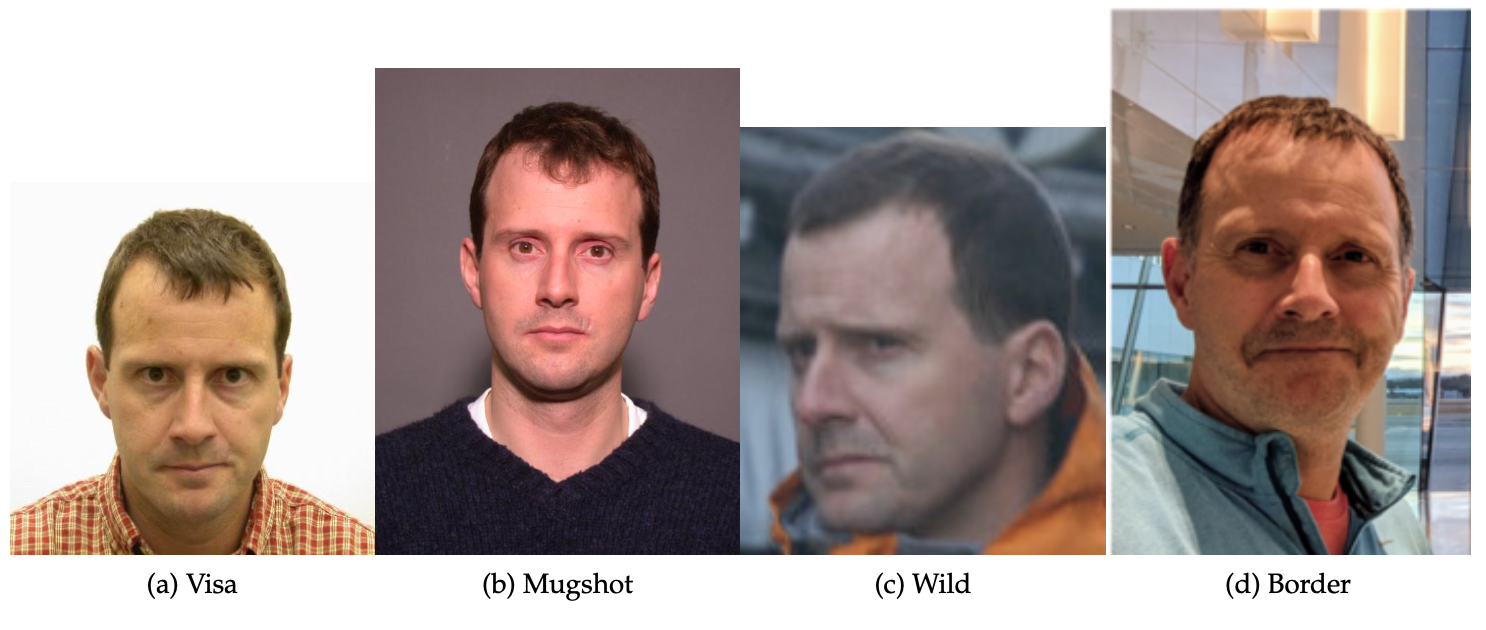
Figure 3 from NIST’s FRVT 1:1 report
The metrics used in the evaluation are the false match rate (FMR), which is the probability of mistaking two images showing different people for the same person and the false non-natch rate (FNMR), which is the failure of recognise two images of the same person as such.
The accuracy of algorithms varies by dataset. Visa images are the “easiest” dataset on which algorithms obtain the highest accuracy, followed by mugshot, border and wild images.
- On Visa images, the best algorithms achieve FNMR<0.3% at FMR=1e-6. FNMR is almost 0.1% at FMR=1e-5 and FNMR<0.1% at FMR=1e-4.
- On Mugshot images, FNMR is between 0.3% and 0.4% (slightly below 0.3% for the best algorithms) at FMR=1e-5 and the DET curve is fairly flat with FNMR staying above 0.2% and below 0.3% for FMR all the way to 3e-2. This indicates label noise or really hard images.
- On Wild images, FNMR=3% at FMR=1e-5 for all top algorithms. FNMR is slightly below 3% at FMR=1e-4 and the best algorithm almost reaches FNMR=2% at FMR=1e-3 with the other ones staying slightly above 2%.
Gender and Race
Besides the overall accuracy measures, it is interesting to see how algorithms perform on specific demographic groups. On the mugshot dataset, NIST sets the threshold for each algorithm at FMR=0.001 for white males and then calculates the FMR for same-sex impostor pairs for images annotated with codes for black female, black male, white female and white male. The result for a sample algorithm is below.
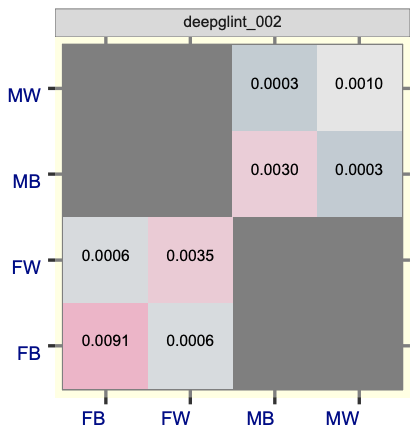
Figure 76 from NIST’s FRVT 1:1 report
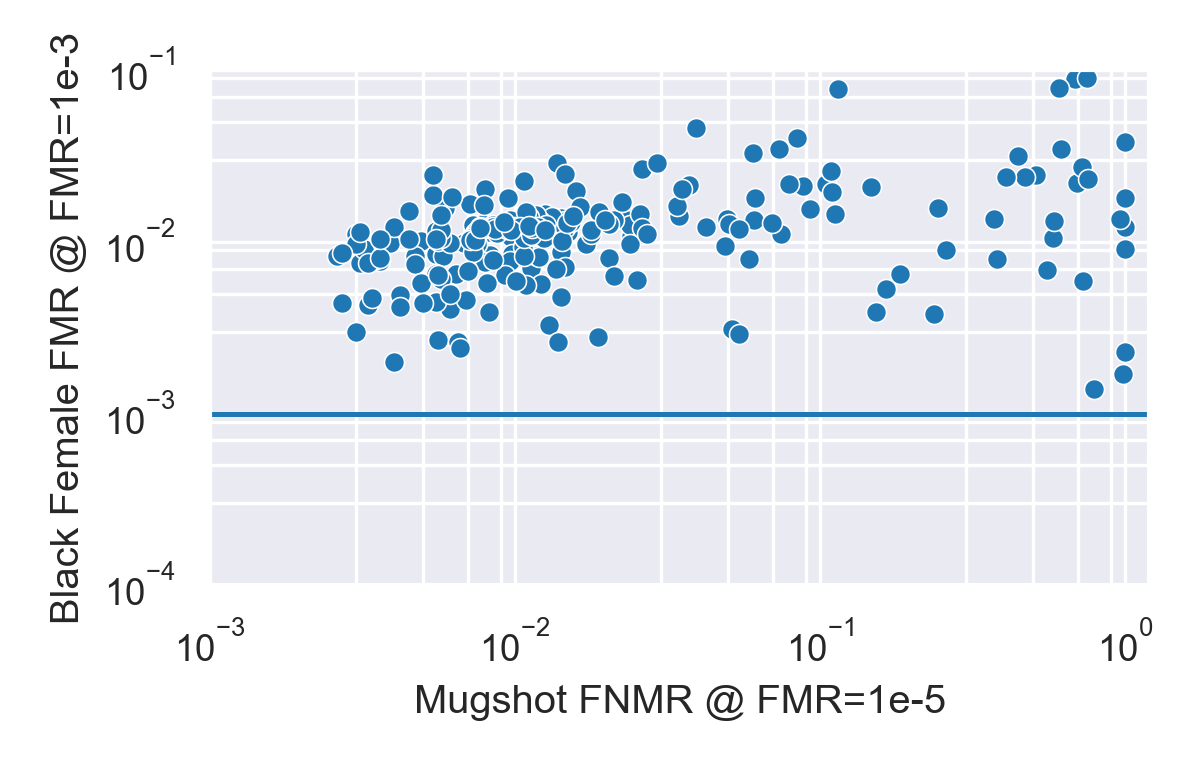
What trends can we observe when we aggregate the results across algorithms? In particular we want to look at the relationship between accuracy and bias. We measure accuracy using FNMR at FMR=1e-5 and bias using FMR on one of the subgroups with the threshold set at FMR=1e-3 on white males.
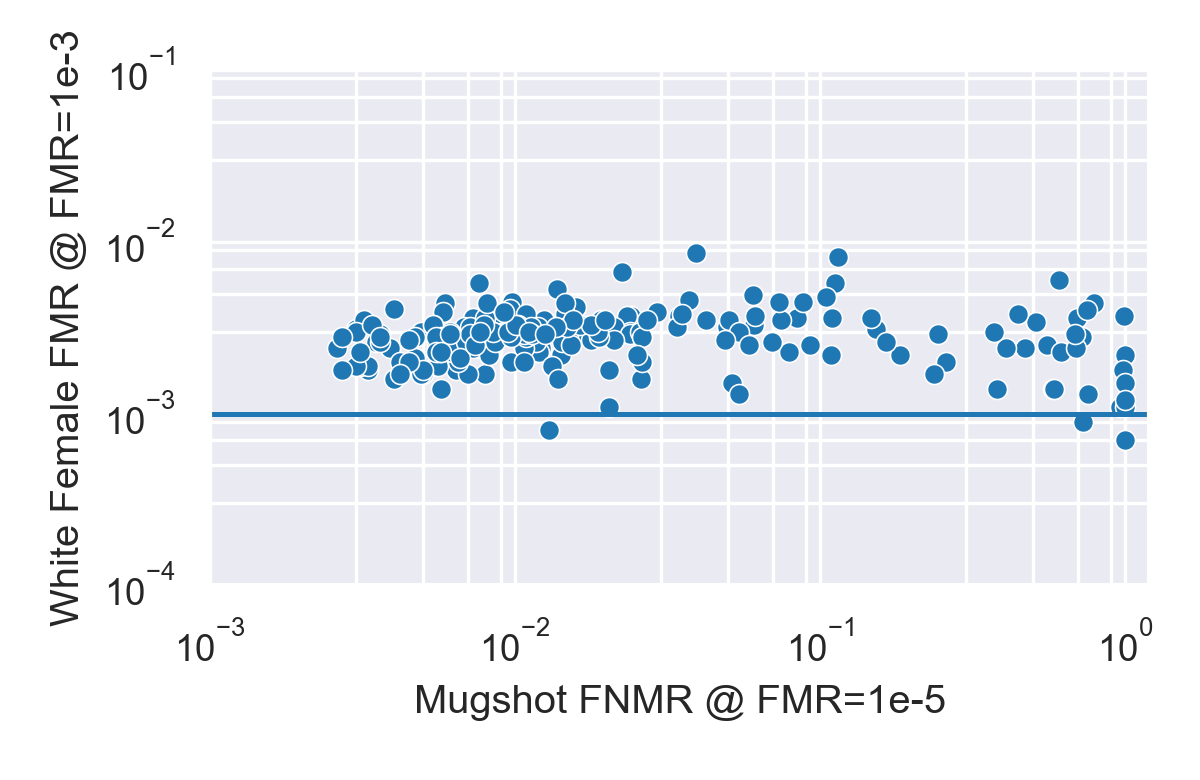
White female FMR plotted against overall FNMR.
What do we see? Let’s start with white females and compare the FMR for white females (while FMR is kept at 1e-3 for white males) against overall FNMR on the mugshot dataset.
- Almost all algorithms have a higher FMR for white females than for white males (the latter is set at 1e-3 and represented by the blue line). This consistency is particularly remarkable since they have been developed independently by different companies using different datasets. And yet almost all of them have higher FMR for females than for males.
- Three algorithms have lower FMR for white females, but these algorithms are significantly less accurate than others. Their FNMR is >1%, compared to <0.2% for the most accurate ones.
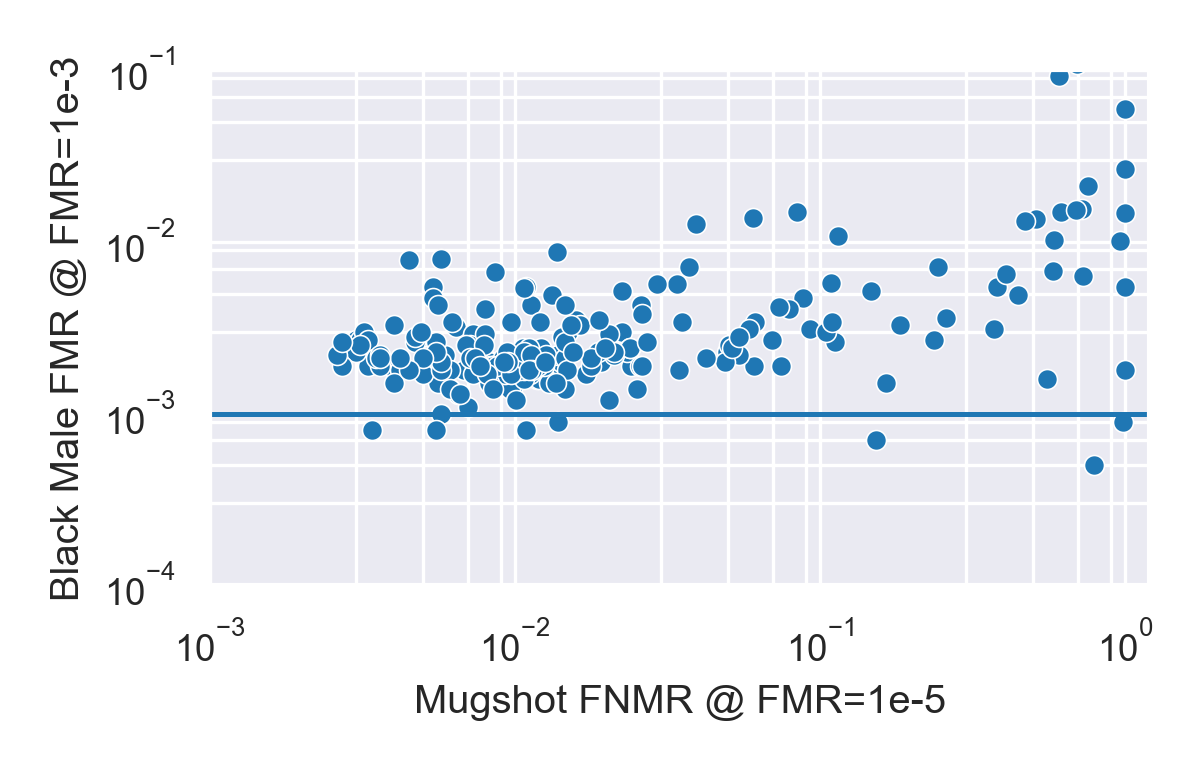
We can repeat the exercise and look at the FMR for black males and black females plotted against the FNMR. Our observations are similar
- With few exceptions, most algorithms show higher FMR for both black males and black females compared to white males.
- A notable exception is algorithm psl-005, which has low overall FNMR as well low FMR on each subgroup, with FMR on black males lower than for white males.
- On average, the FMR for black females is significantly higher (around 0.1) than for black males or white females (around 0.002).
For each algorithm we can look at the four FMR values along the diagonal, i.e., the FMR for white males (MW), black males (MB), white females (FW) and black females (FB) and ask how they are ordered: for example, MW < MB < FW < FB is one possible ordering. In principle, there are 24 different ways to order the results. How many of them do we actually encounter?
| Order | Count |
|---|---|
| MW < MB < FW < FB | 150 |
| MW < FW < MB < FB | 72 |
| MW < FW < FB < MB | 7 |
| MB < MW < FW < FB | 5 |
| MB < MW < FB < FW | 2 |
| FW < MW < FB < MB | 2 |
| MW < MB < FB < FW | 1 |
| FW < MW < MB < FB | 1 |
Out of the 24 possible orderings we encounter only 8!
- For 150 out of the 240 analysed algorithms the FMR values are ordered as MW < MB < FW < FB, which can be summarised as Male < Female and White < Black within each gender.
- The top two orderings, covering 92.5% of all algorithms, can be summarised as: white males first, black females last.
- What about the tail of the remaining 18 algorithms? Out of those only two (psl-003, psl-005) have an FNMR<1% and only six have an FNMR<2%. The FNMR of the remaining ones is 60% or higher.
Conclusion
The NIST FRVT reports are a unique source of information, because they contain hundreds of algorithms evaluated using the same protocol, making the results comparable. Looking at FR algorithms from a population perspective provides new insights into the prevalence of bias in FRTs. It doesn’t tell us why bias exists, but the fact that we encounter it so consistently does tell us something. At the very least it tells us, that removing bias from face recognition is going to be a very difficult task.
Methods
To extract the data from the report in a machine-readable format I used Tabula, followed by analysis using pandas and a jupyter notebook. The data and code can be found in this repository.
-
Participation in the FRVT is not a prerequisite to selling FRT to US government agencies. For example, both IBM and Amazon sell FRT to the US government, but neither has so far participated in the FRVT. In the case of Amazon, the reason is that “Amazon Rekognition can’t be ‘downloaded’ for testing outside of AWS, and components cannot be tested in isolation while replicating how customers would use the service in the real world.” Considering that more than 100 companies have managed to “download” their FRT for testing by NIST, the justification rings hollow. ↩